June 2026 Midlands Market Update: What's Actually Happening

Jill Hydrick
June 2, 2026
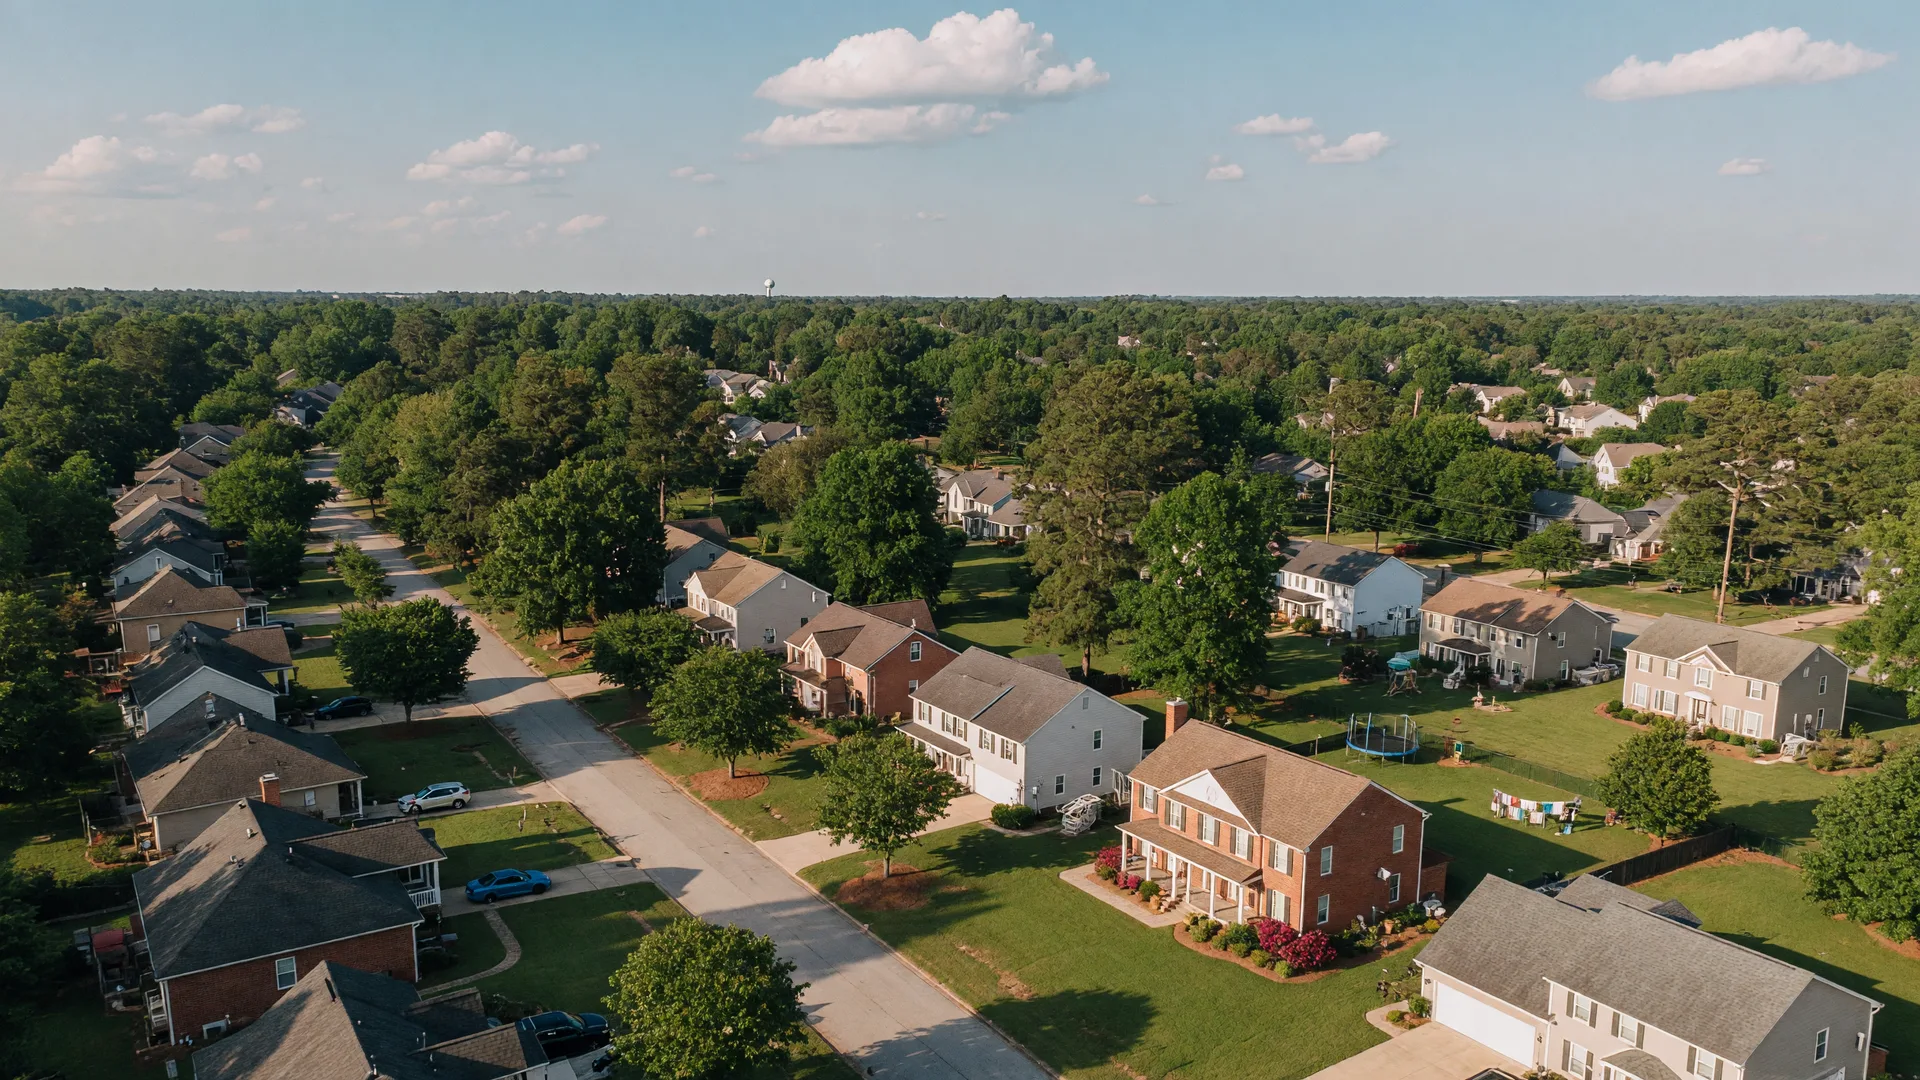
Inventory is up across the Midlands. If you have been waiting for more options, they are here. But the market is not the same everywhere — some areas are heating up while others are cooling off. Here is what the June numbers actually show.
The Headline
Inventory across the Midlands is up significantly compared to last year — in most areas between 28% and 44%, and in some pockets much higher. That means more choices for buyers. But closed sales are mixed, and prices depend entirely on which neighborhood you are in.
By the Numbers
Irmo / St. Andrews / Ballentine (Area 1). This area sits on the northwest side of Columbia and covers some of the most established suburbs in the Midlands. Median price YTD is $252,000, with 731 homes sold. Days on market average 48, and active inventory sits at 261. This is a market where inventory is growing and buyers have more options than they have had in years. If you are looking in Irmo or Ballentine, you can afford to be selective.
Chapin / NE Lexington / NW Richland (Area 14). Median price $419,848, up 7.6% YTD. Closed sales at 280, days on market 49, and 162 active listings. This is still one of the strongest pockets in the Midlands. Prices are holding strong and homes are moving fast. If you are buying here, do not expect to have weeks to decide on the good ones.
Lake Murray Waterfront (All Shorelines — Areas 20-23). The combined waterfront market tells a story of selectivity. Overall median is $999,900, up 8% year over year. Average days on market sit at 70, with 107 closed sales and 112 active listings. Buyers have options and they are taking their time. Breaking it down by shoreline: the Irmo/Chapin side leads at $1,120,000, followed by the Saluda side at $1,110,000, the Lexington side at $950,000, and the Newberry side at $672,500. If you are selling waterfront, the homes that are updated and priced right are still moving. The ones that need work or push the top of the market — those are sitting.
Columbia Northeast (Area 4). Median price $299,950, up 1.8% YTD. Closed sales total 1,392 YTD, with homes averaging 54 days on market. Inventory sits at 803, a 43.9% jump from last year — the biggest inventory increase in the Midlands. Buyers have real leverage here. If you are looking in the northeast, you have more choices and more room to negotiate than anywhere else in the region.
Rest of Columbia. The rest of the Midlands is a mixed bag with varying trends. The City of Columbia (Area 3, North to I-20) shows a median of $218,750 with 264 sold and 47 days on market, though inventory of 135 suggests continued buyer opportunity. Columbia South (Area 7) sees a median of $289,000 with 203 sold and a brisk 35 days on market, with only 84 active listings. Cayce/West Columbia (Area 2) holds at $255,000 median with 563 sold, 47 days on market, and 241 inventory — consistent demand across the river. Rural Richland (Area 9) shows a median of $259,900 with 89 sold, a slower 84 days on market, and 72 active listings. Some pockets are seeing price corrections while others gain momentum. The key is knowing which neighborhood fits your needs and price range.
What This Means for You
If you are buying: more inventory means more choices and more negotiating power than you have had in the past two years. But it varies by area — in Lexington and Chapin, good homes still move fast. In other areas, you can take your time and make sure it is right.
If you are selling: price it right from the start. Buyers have options now and they are not overpaying. Homes that are priced correctly and show well are still selling. Overpriced listings are sitting, and the longer a home sits, the harder it is to sell at any price.
If you are relocating: the Midlands market is more buyer-friendly than it has been in a while. More homes, more time to decide, and prices that make sense. This is a good window to make your move, especially if you are coming from a market where prices never came down.
Have questions about what the numbers mean for your specific neighborhood? Reach out — I track this data every month and can tell you what is happening on your street.
Talk to Jill Jill Hydrick
REALTOR® with EXIT Real Estate Consultants · SC License #102864
Nine years in real estate, 34 years in accounting. She sees the financial side of a transaction the way most agents never will.